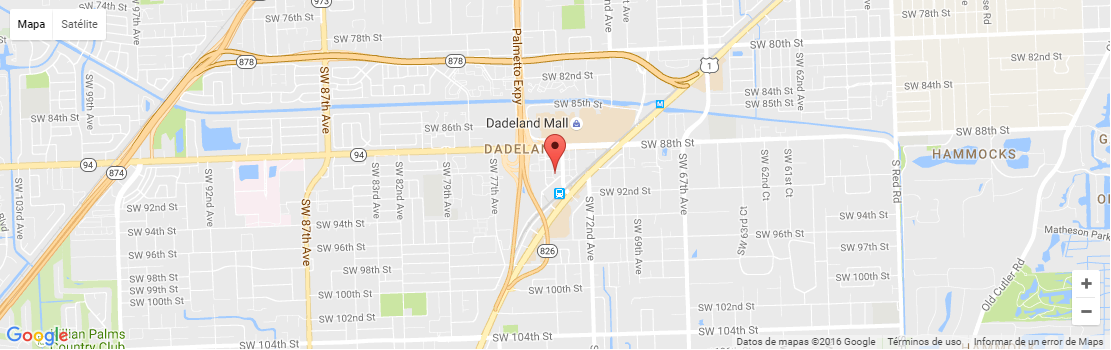
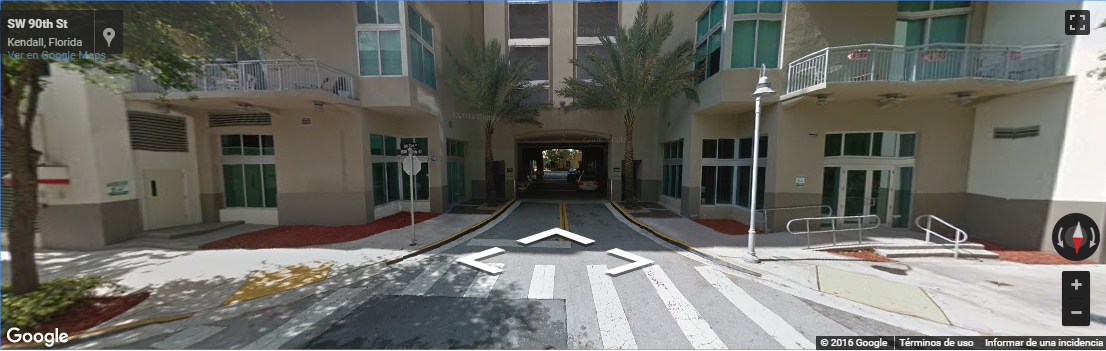
Beautiful 2 bedroom 2 bathrooms corner unit with balcony, located in the heart of prestigious Downtown Dadeland. High quality features, wood cabinets in kitchen & bathrooms, hard wood flooring, walk-in-closets, unit overlooks the center of the community, washer & dryer inside unit, gym, rooftop infinity pool. HOA fee includes basic cable, internet, water, sewer & trash services. Downtown Dadeland was designed to provide its residents with a vibrant community. As you step out of your secured lobby, you find renowned restaurants, bars and shops. Steps away from Publix, Dadeland Mall and easy access to metro rail w/ stops at Civic Center (UM Hospitals and Jackson Memorial Hospital & Clinics) Government Center, Brickell center, UM University Station, Brickell, Bayfront Park, Coconut Grove.
| Address | Unit # | Price | %Chng | Bed/Bath | Square Feet | Square m2 | Maint/$ |
|---|---|---|---|---|---|---|---|
| 9001 SW 77th Ave #C705 | C705 | $235,000 | 1/1 | 699 | 65 | $329 | |
| 9001 SW 77th Ave #C805 | C805 | $240,000 | 1/1 | 761 | 71 | $329 | |
| 9159 SW 77th Ave #209 | 209 | $245,000 | 1/1 | 733 | 68 | $309 | |
| 643 Vista Isles Dr #1811 | 1811 | $299,000 | 2/2 | 1,065 | 99 | $446 | |
| 9175 SW 77th Ave #302 | 302 | $318,000 | 2/2 | 1,090 | 101 | $506 | |
| 6886 N Kendall Dr #D309 | D309 | $325,000 | 1/1 | 904 | 84 | $458 | |
| 7350 SW 89th St #409S | 409S | $335,000 | 1/1 | 759 | 71 | $791 | |
| 7280 SW 89th St #D302 | D302 | $345,000 | 1/1 | 941 | 87 | $727 | |
| 7355 SW 89th St #603N | 603N | $349,000 | 1/1 | 759 | 71 | $792 | |
| 9066 SW 73rd Ct #1202 | 1202 | $349,000 | 1/1 | 797 | 74 | $876 | |
| 7350 SW 89th St #403S | 403S | $355,000 | 1/1 | 759 | 71 | $792 | |
| 7270 SW 89th St #C506 | C506 | $355,000 | 1/1 | 770 | 72 | $587 | |
| 9066 SW 73rd Ct #804 | 804 | $359,000 | 1/1 | 657 | 61 | $733 | |
| 9143 SW 77th Ave #B403 | B403 | $370,000 | 3/2 | 1,205 | 112 | $580 | |
| 559 N University Dr #39 | 39 | $372,000 | 2/2 | 1,756 | 163 | $439 |
| Unit # | Closed Date | Sold Price | List Price | Bed | Bath | Living Area | Days on Market |
|---|---|---|---|---|---|---|---|
| 407S | 09/06/2024 | $325,000 | $330,000 | 1 | 1 | 759 | 1 month |
| 207B | 08/29/2024 | $251,000 | $254,900 | 1 | 1 | 677 | 3 months |
| A303 | 04/30/2024 | $255,000 | $255,000 | 1 | 1 | 855 | 1 month |
| Number of Units | Avg Price | Avg $/SQFT | Lowest Sale Price | Highest Sale Price | Avg Days on Market |
|---|---|---|---|---|---|
| 3 | $277,000 | $370 | $251,000 | $325,000 | 72 |
| Unit # | Closed Date | Sold Price | List Price | Bed | Bath | Living Area | Days on Market |
|---|---|---|---|---|---|---|---|
| 1605 | 10/04/2024 | $475,000 | $495,000 | 2 | 2 | 1,350 | 3 months |
| 312 | 09/30/2024 | $407,000 | $419,900 | 2 | 2 | 1,129 | 1 month |
| A502 | 08/28/2024 | $433,000 | $465,000 | 2 | 2 | 1,119 | 7 months |
| 1708 | 08/26/2024 | $396,000 | $429,000 | 2 | 2 | 1,150 | 2 months |
| 1609 | 08/05/2024 | $495,500 | $525,000 | 2 | 2 | 1,467 | 5 months |
| 2601 | 08/01/2024 | $550,000 | $599,000 | 2 | 2 | 1,429 | 2 months |
| 1805 | 07/22/2024 | $489,000 | $495,000 | 2 | 2 | 1,350 | 4 months |
| 512 | 05/07/2024 | $415,000 | $434,900 | 2 | 2 | 0 | 4 months |
| D107 | 04/30/2024 | $395,000 | $415,000 | 2 | 2 | 982 | 4 months |
| E202 | 04/23/2024 | $320,000 | $340,000 | 2 | 1 | 1,056 | 8 months |
| 2007 | 03/25/2024 | $440,000 | $455,000 | 2 | 2 | 1,150 | 4 months |
| 2403 | 03/25/2024 | $497,500 | $525,000 | 2 | 2 | 1,334 | 4 months |
| Number of Units | Avg Price | Avg $/SQFT | Lowest Sale Price | Highest Sale Price | Avg Days on Market |
|---|---|---|---|---|---|
| 12 | $442,750 | $350 | $320,000 | $550,000 | 139 |
| Unit # | Closed Date | Sold Price | List Price | Bed | Bath | Living Area | Days on Market |
|---|---|---|---|---|---|---|---|
| 10/16/2024 | $875,000 | $899,900 | 3 | 2 | 1,892 | 5 months | |
| 300 | 08/16/2024 | $822,500 | $850,000 | 3 | 2 | 1,842 | 3 months |
| 08/08/2024 | $1,246,000 | $1,296,000 | 3 | 3 | 2,815 | 3 months |
| Number of Units | Avg Price | Avg $/SQFT | Lowest Sale Price | Highest Sale Price | Avg Days on Market |
|---|---|---|---|---|---|
| 3 | $981,167 | $466 | $822,500 | $1,246,000 | 120 |
| Unit # | Closed Date | Sold Price | List Price | Bed | Bath | Living Area | Days on Market |
|---|---|---|---|---|---|---|---|
| 7 | 09/05/2024 | $1,670,000 | $1,670,000 | 4 | 3 | 2,858 | 1 year |
| 6 | 07/30/2024 | $1,645,000 | $1,670,000 | 4 | 3 | 2,881 | 2 years |
| Number of Units | Avg Price | Avg $/SQFT | Lowest Sale Price | Highest Sale Price | Avg Days on Market |
|---|---|---|---|---|---|
| 2 | $1,657,500 | $582 | $1,645,000 | $1,670,000 | 703 |
www.metropolis-miami.com is not responsible for the accuracy of the information listed above. The data relating to real estate for sale on this web site comes in part from the Internet Data Exchange Program and the South East Florida Regional MLS and is provided here for consumers personal, non-commercial use, It may not be used for any purpose other than to identify prospective properties consumers may be interested in purchasing. Real Estate listings held by brokerage firms other than the office owning this web site are marked with the IDX logo. Data provided is deemed reliable but not guaranteed. Listing provided by Florida Realty of Miami Corp
© Copyright 2012-2016. Brenda Bassett | Broker-Associate | 7266 SW 88 St | Miami, FL 33156 | Cell: 305-707-4007
Magic City Realtors is an independent real estate brokerage servicing the South Florida real estate community