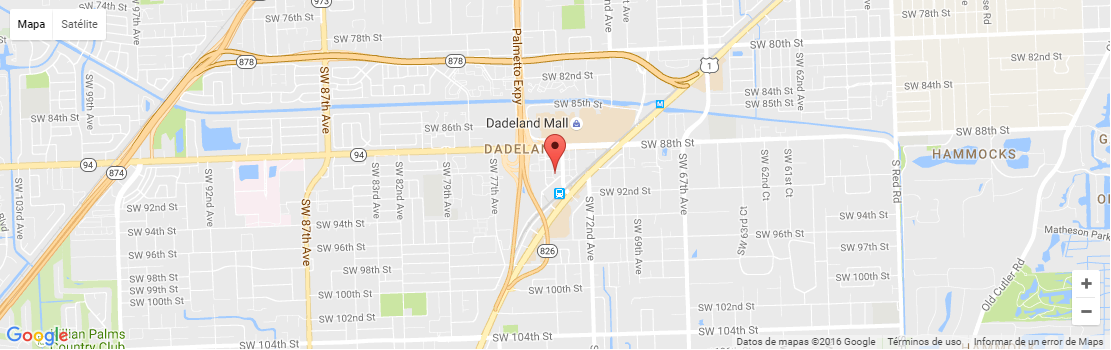
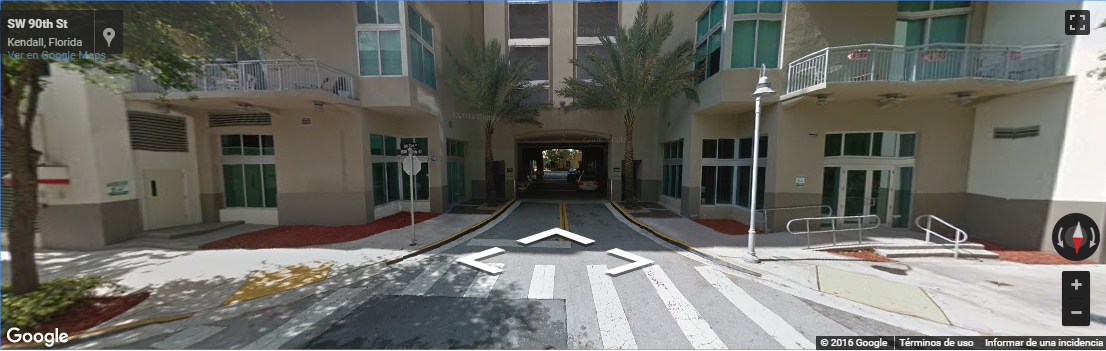
Largest Floor plan in the building! Substantially remodeled 2 bedroom, 2 bath unit plus den - easily convertible into a 3rd bedroom or private office. This spacious unit features beautiful polished marble flooring throughout the living area and bathrooms with elegant wood-look tile in bedrooms. Gorgeous unobstructed sunset views. Unit Includes one assigned parking space with option to rent a second space and a private storage unit. Building offers: 2 heated pools, jacuzzi, 2 gyms, clubroom, saunas, 24 hour concierge, 24 hour valet and 24 hour security patrol. FOB secured building. Walk to Dadeland Metro Station South, Publix, Trader Joes, Dadeland Mall and all up and coming Restaurants.
| Address | Unit # | Price | %Chng | Bed/Bath | Square Feet | Square m2 | Maint/$ |
|---|---|---|---|---|---|---|---|
| 9001 SW 77th Ave #C705 | C705 | $190,000 | 1/1 | 699 | 65 | $580 | |
| 12760 Vista Isles #724 | 724 | $220,000 | 1/1 | 0 | 0 | $438 | |
| 9001 SW 77th Ave #C204 | C204 | $225,000 | 2/1 | 699 | 65 | $743 | |
| 9066 SW 73rd Ct #1903 | 1903 | $260,000 | 1/1 | 657 | 61 | $721 | |
| 6900 N Kendall Dr #A102 | A102 | $269,700 | 1/1 | 852 | 79 | $754 | |
| 6900 N Kendall Dr #A303 | A303 | $275,000 | 1/1 | 855 | 79 | $856 | |
| 6900 N Kendall Dr #A405 | A405 | $279,000 | 1/1 | 855 | 79 | $1,017 | |
| 6886 N Kendall Dr #D102 | D102 | $284,995 | 1/1 | 852 | 79 | $754 | |
| 9055 SW 73rd Ct #1603 | 1603 | $285,000 | 1/1 | 657 | 61 | $769 | |
| 9066 SW 73 CT #1702 | 1702 | $287,900 | 1/1 | 797 | 74 | $721 | |
| 9055 SW 73rd Ct #707 | 707 | $299,000 | 1/1 | 845 | 79 | $1,119 | |
| 9066 SW 73rd Ct #2002 | 2002 | $299,000 | 1/1 | 797 | 74 | $721 | |
| 9066 SW 73 CT #1802 | 1802 | $299,900 | 1/1 | 797 | 74 | $721 | |
| 6884 N Kendall Dr #C407 | C407 | $309,000 | 2/2 | 1,110 | 103 | $988 | |
| 9055 SW 73rd Ct #903 | 903 | $310,000 | 1/1 | 657 | 61 | $769 |
| Unit # | Closed Date | Sold Price | List Price | Bed | Bath | Living Area | Days on Market |
|---|---|---|---|---|---|---|---|
| 1103S | 12/02/2025 | $326,000 | $345,000 | 1 | 1 | 828 | 1 month |
| 207E | 11/13/2025 | $220,000 | $225,000 | 1 | 1 | 677 | 1 month |
| 1703 | 11/06/2025 | $149,000 | $149,000 | 1 | 1 | 657 | 1 month |
| 304 | 10/14/2025 | $170,000 | $195,000 | 1 | 1 | 725 | 2 months |
| 703 | 09/30/2025 | $320,000 | $349,000 | 1 | 1 | 890 | 3 months |
| Number of Units | Avg Price | Avg $/SQFT | Lowest Sale Price | Highest Sale Price | Avg Days on Market |
|---|---|---|---|---|---|
| 5 | $237,000 | $327 | $149,000 | $326,000 | 63 |
| Unit # | Closed Date | Sold Price | List Price | Bed | Bath | Living Area | Days on Market |
|---|---|---|---|---|---|---|---|
| A211 | 12/17/2025 | $340,000 | $355,000 | 2 | 2 | 1,207 | 6 months |
| 2401 | 12/15/2025 | $508,540 | $570,000 | 2 | 2 | 1,429 | 6 months |
| 621S | 12/12/2025 | $560,000 | $579,900 | 2 | 2 | 1,657 | 1 month |
| 1005S | 12/08/2025 | $440,000 | $450,000 | 2 | 2 | 1,286 | 1 month |
| 301 | 11/26/2025 | $385,000 | $395,000 | 2 | 2 | 1,000 | 1 month |
| 1409 | 11/17/2025 | $417,000 | $445,000 | 2 | 2 | 1,467 | 4 months |
| 2107 | 11/03/2025 | $530,000 | $550,000 | 2 | 2 | 1,150 | 9 months |
| 606 | 10/24/2025 | $340,000 | $370,000 | 2 | 1 | 957 | 2 months |
| 906 | 10/24/2025 | $430,000 | $449,000 | 2 | 2 | 1,350 | 8 months |
| 310 | 10/15/2025 | $372,900 | $389,888 | 2 | 1 | 997 | 2 months |
| 2011S | 10/08/2025 | $485,000 | $495,000 | 2 | 2 | 1,155 | 3 months |
| 602S | 10/08/2025 | $415,000 | $429,900 | 2 | 2 | 1,346 | 3 months |
| 314 | 09/23/2025 | $248,000 | $249,900 | 2 | 2 | 1,115 | 2 months |
| 1210 | 09/17/2025 | $467,525 | $485,000 | 2 | 2 | 1,467 | 6 months |
| Number of Units | Avg Price | Avg $/SQFT | Lowest Sale Price | Highest Sale Price | Avg Days on Market |
|---|---|---|---|---|---|
| 14 | $424,212 | $356 | $248,000 | $560,000 | 135 |
| Unit # | Closed Date | Sold Price | List Price | Bed | Bath | Living Area | Days on Market |
|---|---|---|---|---|---|---|---|
| 101 | 09/22/2025 | $1,137,500 | $1,175,000 | 4 | 3 | 2,226 | 7 months |
| Number of Units | Avg Price | Avg $/SQFT | Lowest Sale Price | Highest Sale Price | Avg Days on Market |
|---|---|---|---|---|---|
| 1 | $1,137,500 | $528 | $1,137,500 | $1,137,500 | 215 |
www.metropolis-miami.com is not responsible for the accuracy of the information listed above. The data relating to real estate for sale on this web site comes in part from the Internet Data Exchange Program and the South East Florida Regional MLS and is provided here for consumers personal, non-commercial use, It may not be used for any purpose other than to identify prospective properties consumers may be interested in purchasing. Real Estate listings held by brokerage firms other than the office owning this web site are marked with the IDX logo. Data provided is deemed reliable but not guaranteed. Listing provided by United Real Estate Miami
© Copyright 2012-2016. Brenda Bassett | Broker-Associate | 7266 SW 88 St | Miami, FL 33156 | Cell: 305-707-4007
Magic City Realtors is an independent real estate brokerage servicing the South Florida real estate community